
February 2023 - Now is the time.
Since our inception over ten years ago, we have taken a practical approach in regard to an individual’s need to own precious metals. Throughout 5000 years of recorded history, gold and silver have played an important functional role in financial systems regardless of the simplicity or complexity of the culture and time. It stands to reason that owning some makes sense.
Historically, during times of great financial system and/or geopolitical instability, precious metals have played an important role in the protection of assets. Relatively recent examples would be the early and failed experiments with paper money in the Colonial period when paper money was printed to finance the revolutionary and civil wars, the Great Depression, and World War II. In each of these cases, precious metals became more than a monetary item. They acted as “financial insurance,” protecting the savings of those who held them during these difficult times.
We take no pleasure when we examine the global landscape today and see that trends are once again in place where financial systems and geopolitical trends once again make owning precious metals as insurance to protect savings and assets a must. As we move into these times, we are looking for ways to make accumulating gold and silver on our platform even easier and more cost-effective for you and your loved ones to protect your savings and investments in the coming years.
Gold and Silver
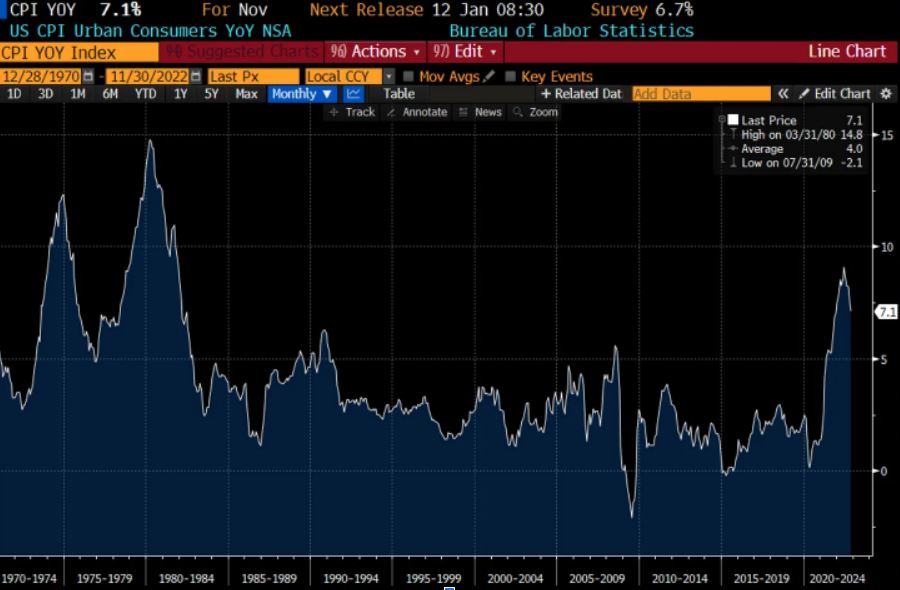
What Do the Charts Say?
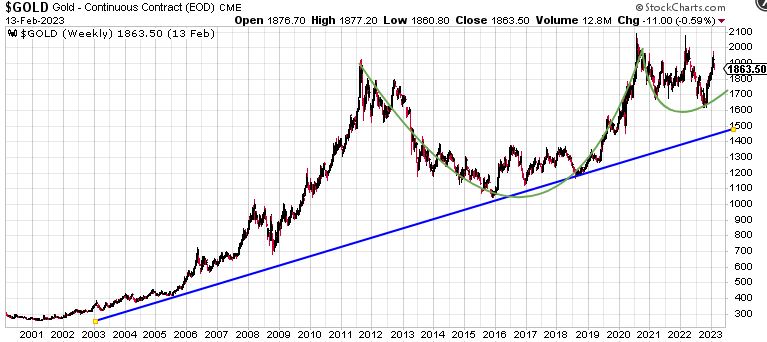
As we get into 2023, we want to provide a long-term perspective on the price action of gold. We focus on gold rather than silver because it while they move in similar directions, gold's moves are less volatile due to the market being much larger and attracting the institutional investment that silver does not. Beginning with the 20-year chart at the left, we want to first draw your attention to the 20-year uptrend line (blue). While the price today indicates support at $1,500 per ounce, we believe it is unlikely to visit this trend line again for several years.
The reason is looking at the price action between 2008 and 2011. After the last financial crisis, the panic sell low did not touch the line. The price of gold then took off and more than doubled in three years. Given the present financial and geopolitical backdrop, the recent drop to $1,625 in late 2022 is possibly a multi-year bottom similar to that seen in late 2009. We then have a very distinct "cup and handle" formation (green arcs). From a charting perspective, this pattern, when formed over more than a decade, such as this one, often marks a powerful multi-year uptrend when the price breaks out above the highs formed in the handle. In this case, it would be a new all-time high above the $2,050 range.
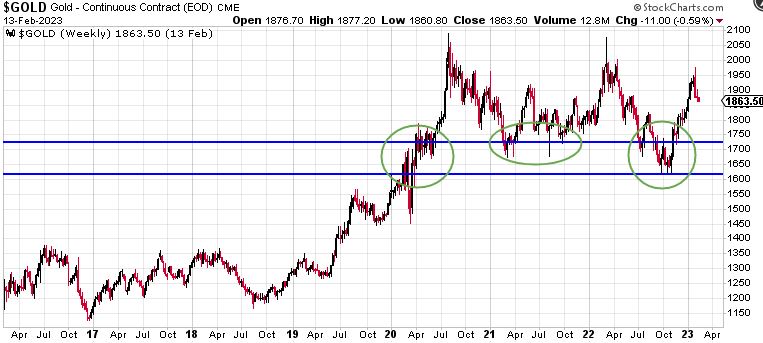
The second chart is a year chart for gold. We see within the handle formation a zone of "congestion." This is generally where bulls and bears fight it out. In early 2020, the bulls won. They continued to win throughout mid 2022 where the initial resistance to break above $1,700 became support where strong buying came in. Last year we saw a lot of pressure where the bears pushed the price below $1,700. However, the bottom of the congestion zone held with a strong bounce back above it. This is positive long-term price action, indicating that gold is asserting its role as geopolitical and financial insurance.
What is happening lately?
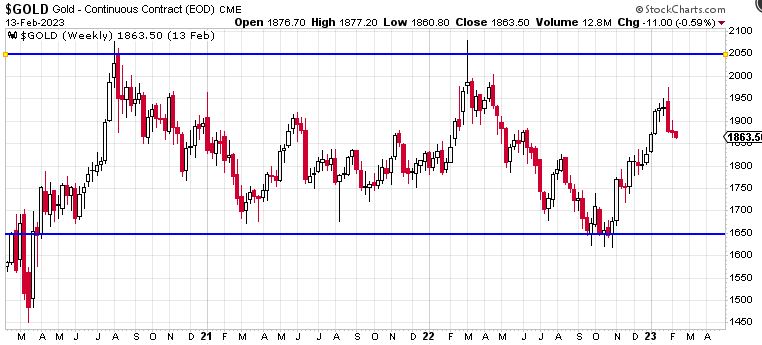
As we zoom in to a five-year window, in the gold chart we see that within the "handle" of the cup-and-handle formation, gold has fallen into a trading range between $1,650 and $2,000. Without the long-term view, one could take the position that there is just as good of a chance of the price action breaking down as breaking out in the coming years. However, the present-day geopolitical and financial system backdrop makes a breakdown unlikely. When gold breaks out to new all-time highs, we could possibly see another doubling of the price, similar to what happened between 2009 and 2011.
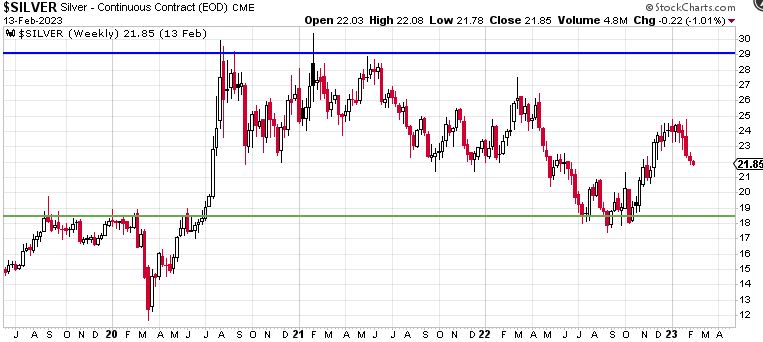
What stands out on the four-year silver chart is that the resistance in the $18.50 range in 2019 and 2020 has now become support. Rather than selling, we see buying when silver approaches that price. This is very good price action, and when silver breaks out above $29, a nice run in the price will likely follow.
As always, these are our opinion only. Please check with your financial advisor prior to making any substantial investments in gold and silver.
Two Additional Charts to Consider
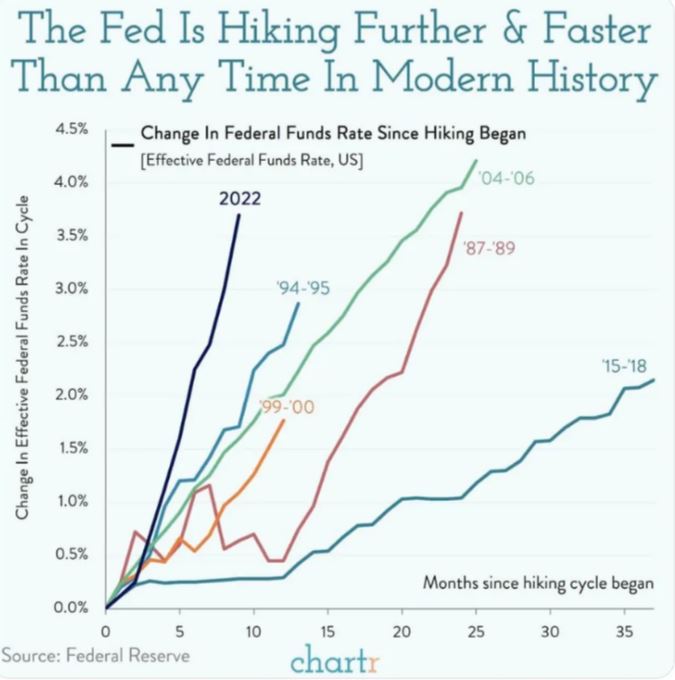
Times have changed...
Note: The US markets will be closed on February 20th, 2023 for President's day.