As they say, a picture is worth a thousand words. Thus, today’s post is mostly visual. Many markets have had a nice run over the last several years. In fact, they are approaching levels that, in the past, have signaled they may be getting overvalued.
The first chart is that of housing.
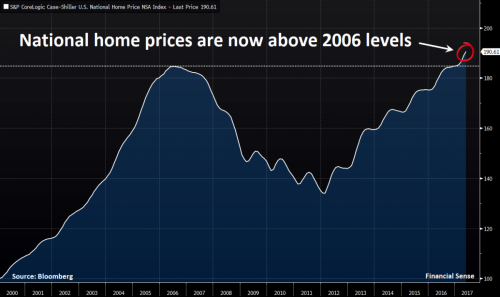
We all remember what happened after 2006. And while housing may yet have some more room to run, it is not a liquid asset as many people learned in the housing crash that followed.
The second chart is one that legendary investor Warren Buffett uses to measure the value of equities.
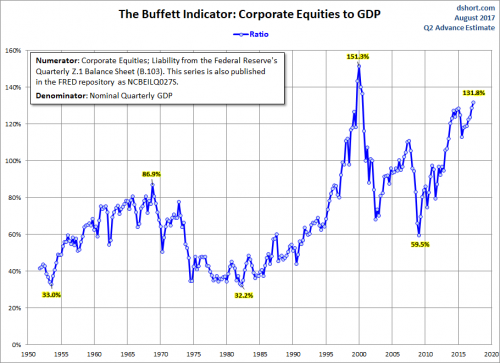
As you can see, it is rising toward the range where sharp reversals have occurred. Maybe that is why Berkshire Hathaway has an unprecedented 40% cash position of over $100 billion.
In an interview in June, he remarked, “We shouldn’t use your money that way for long periods. The question is, ‘Are we going to be able to deploy it?’”
Maybe he should buy some silver like he did in the late 90s and early 2000s when it was $5 per ounce.
Finally, we have the two-year chart of Bitcoin.
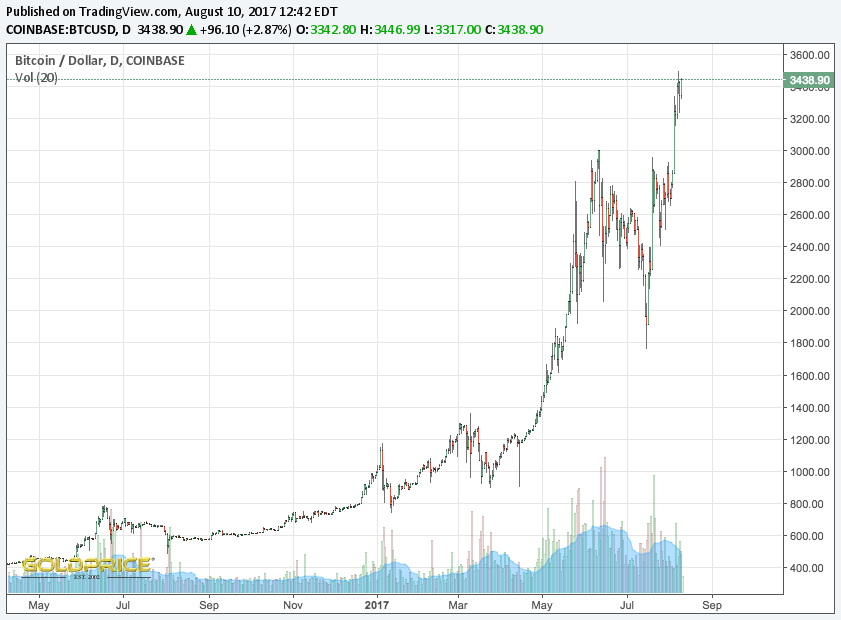
History is not kind to parabolic moves, and that is what Bitcoin and other cryptocurrencies have seen over the last 12 months.
Value Investors Look For Undervalued Assets
Gold and silver have had a difficult stretch over the last five years. However, as we said in January, it appears they have indeed carved out a long-term bottom. This is the zone where value investors establish their position.
It looks like a good time for smart investors to own gold and silver. We can help you do so automatically over time, and even within a self-directed IRA.
(Note: OWNx is not a registered investment advisor company. The information given is for your consideration. You should always consult with an investment advisor before making any investment).